
Bridge Part 1: Vaccine Attitudes
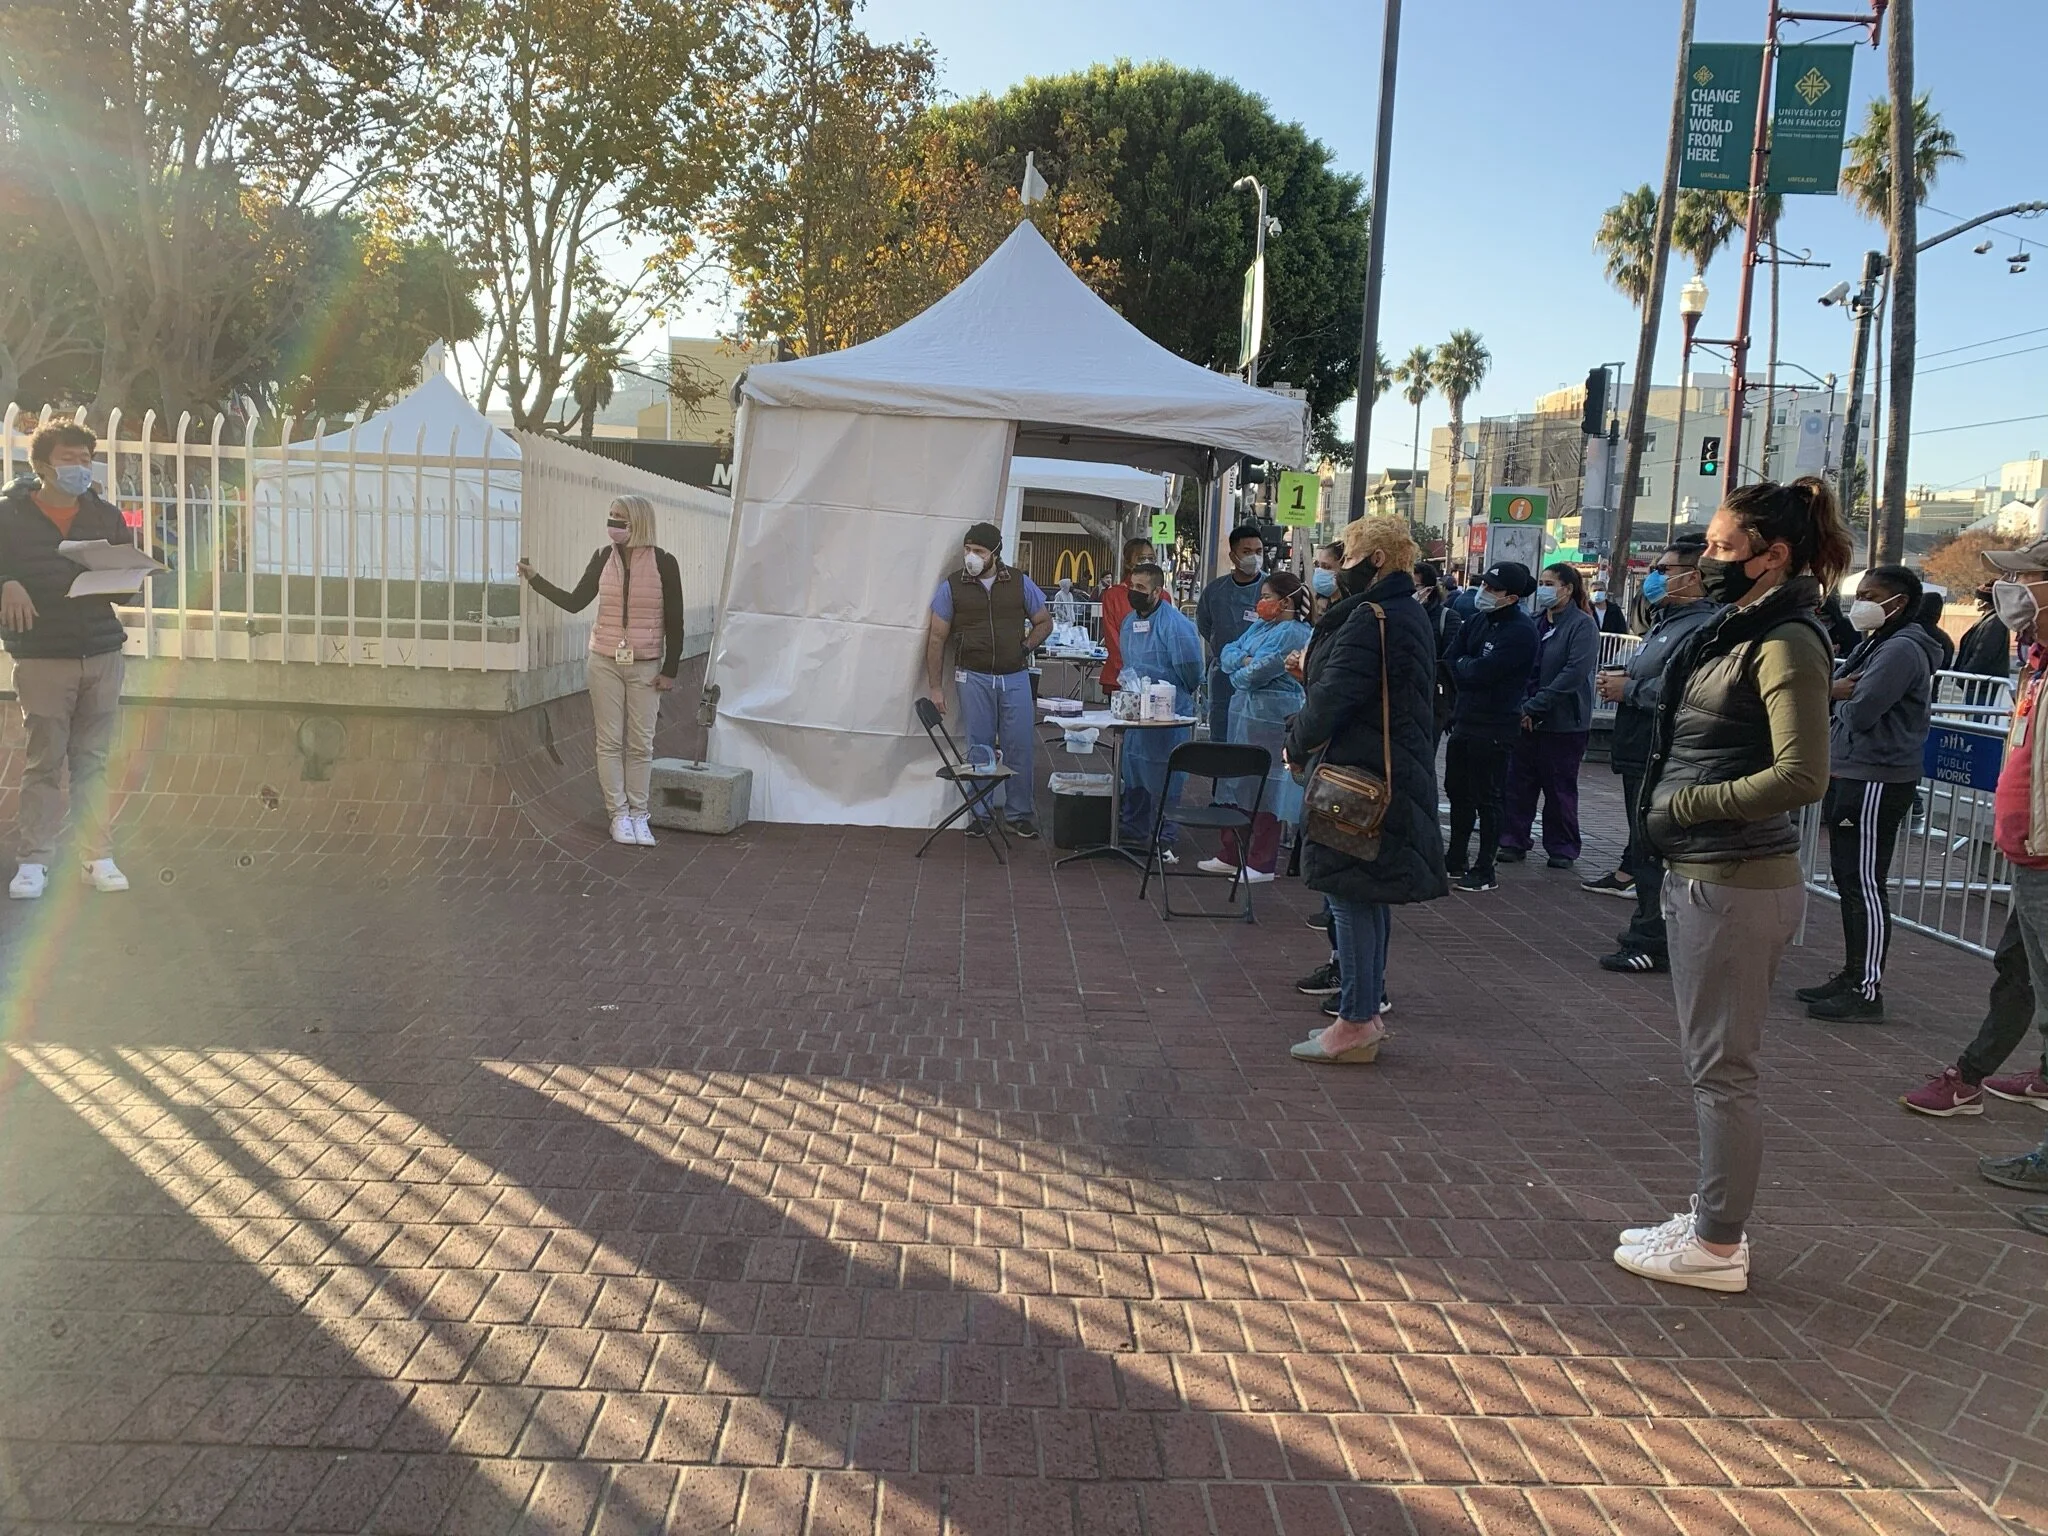
Lessons learned regarding vaccine attitudes in the Mission district from a survey of 4,436 adults during our rapid test and respond event from January 10-29

Study Population
4,436 adults tested and surveyed during January 10-20. 79% of participants completed the vaccine attitudes portion of the questionnaire
By age:
91% were aged less than 65, 9% were 65 years or older
By ethnicity:
73% Latinx 10% White 8% Asian 3% Black
Other important demographic data:
77% report a household income of less than $50,000 a year
46% report being a frontline worker (defined as currently working in food & beverage, health, construction, grocery store, transportation, service, education, law enforcement or postal services)

9.65% of participants tested positive for COVID-19
20% report having health conditions (diabetes, hypertension, lung/heart disease)
57% of participants have health insurance:
45% report having public insurance while 26% report having an HMO (Kaiser)
46% of participants have a primary care provider
20% report knowing someone who has been hospitalized/died of COVID-19

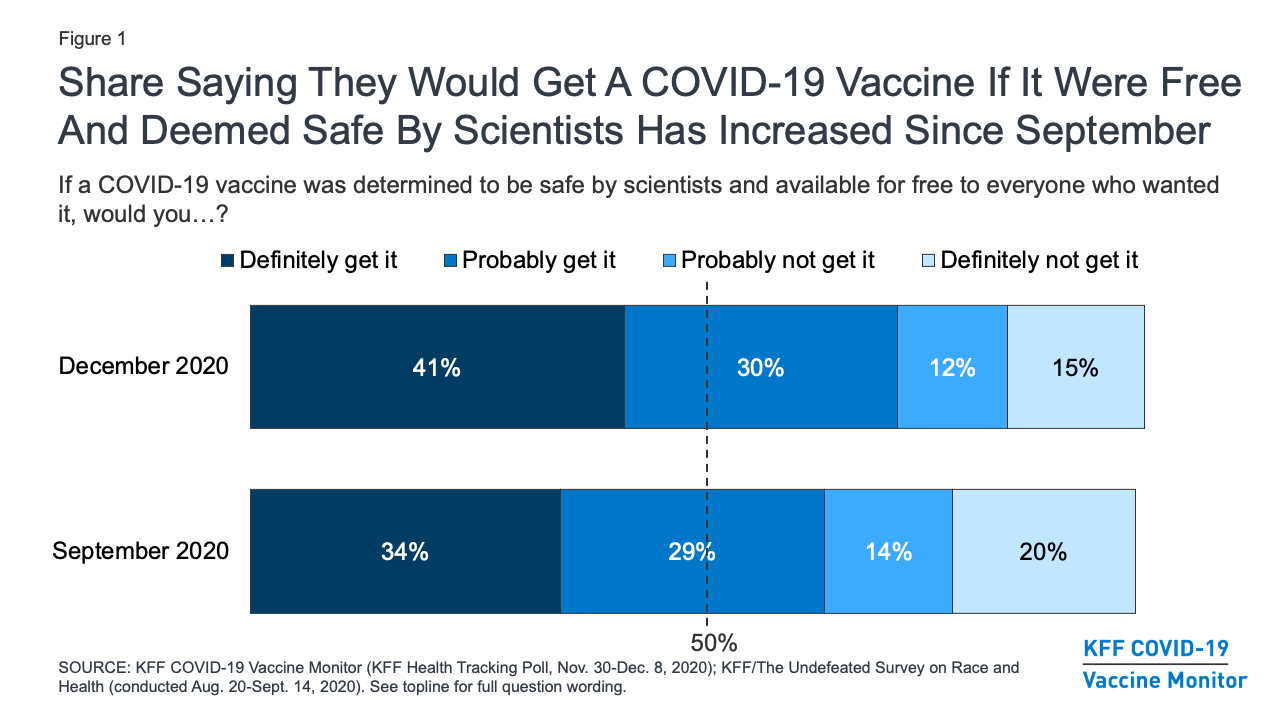
86% of surveyed respondents answered ‘definitely’ or ‘probably’ interested in receiving a vaccine
A national survey by the Kaiser Family Foundation (KFF) reported that 71% of respondents would get the vaccine. Demonstrating that vaccine acceptance may be higher in certain communities than previously predicted.

What factors predict if a person is likely vaccine-hesitant?
Percent indicates likelihood person will probably not or definitely not get the vaccine
The following groups are more likely to be vaccine hesitant:
Persons less than 65 years old
Women
Persons identifying as Black and/or Latinx
Non-frontline workers
Low-income
Non-immigrants
Persons who skip their flu shots
Having vaccine-reluctant friends/family

What factors do not predict if a person is likely vaccine-hesitant?
Percent indicates if person will probably not or definitely not get the vaccine
The following factors do not significantly predict vaccine interest:
Being uninsured
Having health conditions
Knowing someone hospitalized with COVID-19

Of persons not interested, what are some concerns and who do they trust?
Participants not interested in a vaccine indicated they were worried about side effects and didn’t trust the vaccine’s safety while participants who are vaccine-hesitant indicated fair trust in doctors, but low trust in other groups.

What is the best mode of delivery for those interested in a vaccine?
Of participants interested in a vaccine, 47% have a primary care provider, 58% have insurance; most preferred to have their vaccine administered with a primary care provider (44%) or community site (30%)
Vaccine-interested participants reported the following types of health insurance:
44% Public insurance
27% HMO
19% PPO
11% Other
Next Steps?
Bridge Part 2!
Integrating test & respond, vaccine education/delivery and strain surveillance
February through May 2021
Community vaccine site prototype development (mobilization & delivery)
Ongoing rapid test and respond adjacent to community vaccine site
Surveillance for emerging strains in highest risk populations among vaccinated and unvaccinated populations